|
3D motion estimation of atmospheric layers
(back)
Description
We propose a motion estimation method solving for the first time the complex problem
of 3D winds field recovery from satellite image sequences. In order to manage incomplete observations,
physical knowledge on 3D mass exchanges between atmospheric layers have been introduced within an optical
flow scheme.
The estimator is based on a functional minimization. The data term relies on a model which
describes the dynamics of an interacting stack of atmospheric layers. This model applies on
a set of sparse pressure difference images related to the different atmospheric layers. A method
is proposed to reconstruct such observations from satellite top of cloud pressure images and
classification maps. To overcome the problem of sparse observations, a robust estimator is
introduced in the data term. The data term is combined with a smoother that preserves the
bi-dimensional divergent and
vorticity structures of the three-dimensional flow and reinforces regions of homogeneous vertical
winds.
Results
Retrieval of horizontal motions and ascendant winds:
|
ground truth
|
 |
 |
 |
 |
 |
|
3D model
|
 |
 |
 |
 |
 |
|
2D model
|
 |
|
 |
|
 |
|
|
low horizontal wind
|
low altitude vertical wind
|
intermediate horizontal wind
|
high altitude vertical wind
|
high horizontal wind
|
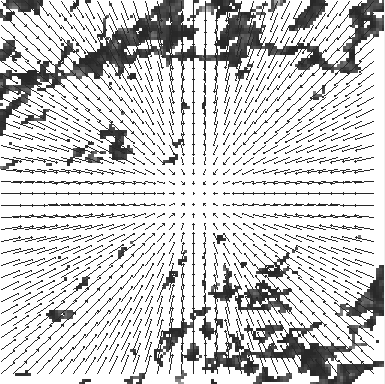
Upper line : ground truth. Horizontal velocity fields used
for simulation superimposed on cloud pressure difference images for a high (left), a medium (middle)
and a low (right) layer. White areas correspond to regions where no data are available. Vertical wind
fields used for simulation are displayed in-between the latter images.Middle line : comparison
with 3D motion estimates. Horizontal winds estimated with the 3D model are superimposed on
cloud pressure difference images for the high (left), the medium (middle) and the low (right) layer
and estimated vertical wind maps are displayed in-between the latter images.
Bottom line : failure of a 2D model. Horizontal winds estimated
with a 2D model are superimposed on cloud pressure difference images for the high (left),
the medium (middle) and the low (right) layer.
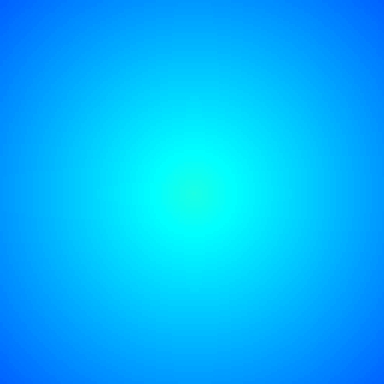
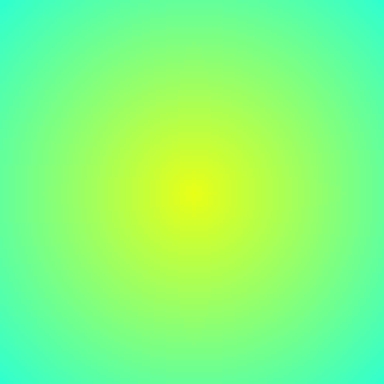
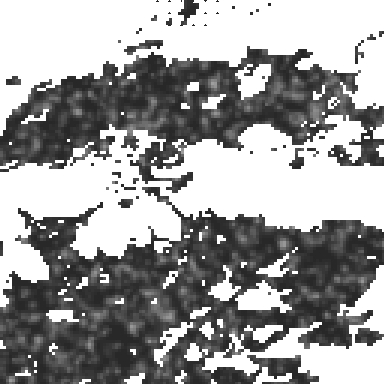
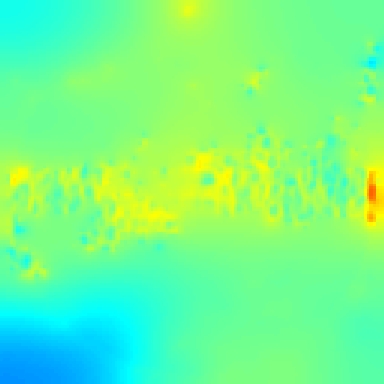
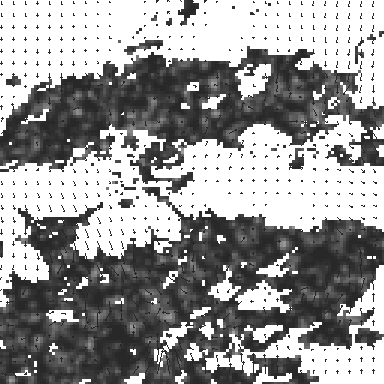
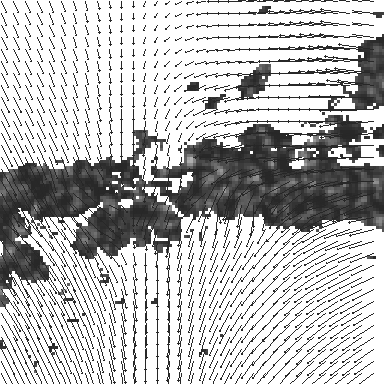
Estimation of 3D winds in atmospheric convective systems :
Images over the Gulf
Guinea the 5-June-2004 from 13h30 to 14h15 UTC. Cloud pressure difference images of the highest
layer at 4 consecutive times. Estimated horizontal wind vectors which have been superimposed on the
images range in the interval [0,10] m/s. Retrieved vertical wind maps on the highest layer
lower boundary have been superimposed on the pressure difference images. Vertical winds range in the
interval [-0.5,0.5] m./s.
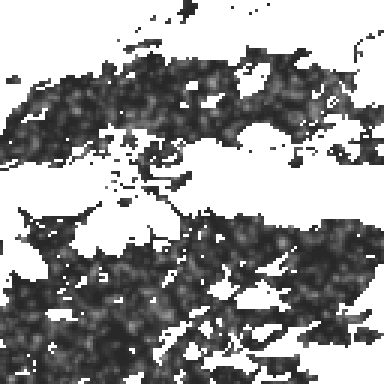
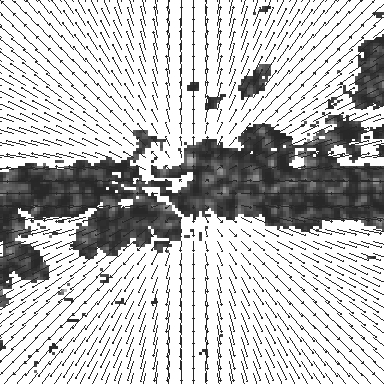
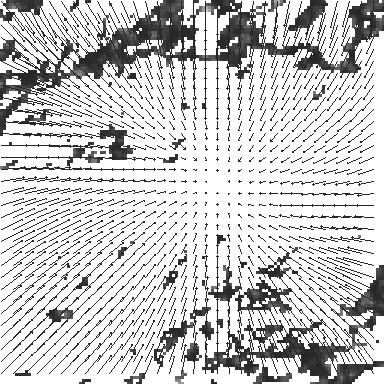
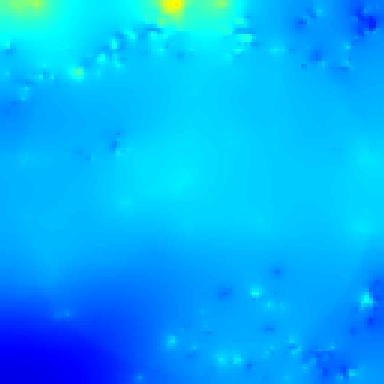
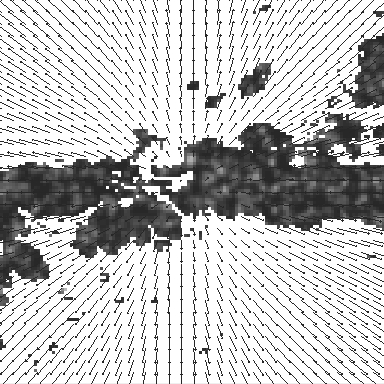
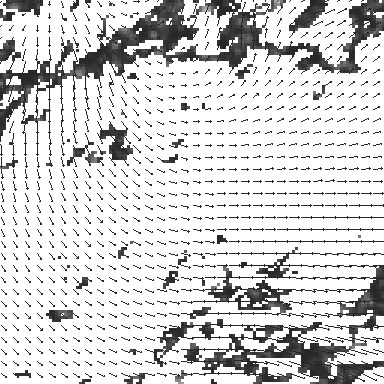
Estimation of 3D winds in a 3-Layer atmosphere :
 |
 |
 |
|
low horizontal wind
|
intermediate horizontal wind
|
high horizontal wind
|
 |
 |
|
low altitude vertical wind
|
high altitude vertical wind
|
Horizontal and vertical winds in
correspondence to cloud pressure difference images (over the north Atlantic Ocean the 5-June-2004 from
12h00 to 13h00 UTC) related to the high (right), the middle (middle) and the low (left) layers. Estimated
horizontal wind vectors range in the interval of [0,15] m/s. Estimated vertical winds range in the interval [-0.2,0.4]
m/s.
Reference
P. Héas, E. Mémin. 3D motion estimation of atmospheric layers from image sequences . Conditionally accepted for publication in IEEE transactions on Geosciences and Remote Sensing.
Soft
P. Héas, E. Mémin, N. Papadakis. Demonstrator on layer motion estimation methods (2D and 3D estimation) . Fluid Project deliverable 4.3, 2007 (soft)
|